Positioning
Based on customer survey data, positioning analysis represents products along relevant dimensions from the customers’ points of view, and creates a simple-to-read mapping of the competitive landscape, highlighting unique positioning, value propositions, competitive threats, market opportunities, and me-too products.
What you put in:
- Customers’ rating of focal brand and key competitors on dimensions of merit
- Individual customer preference ratings of all competitors
What you get out:
- Perceptual map, showing which brands are closest to one another
- Attributes that differentiate brands
- Locations of individual customer preferences
- Projected market share associated with current and new positions on the map
Background
Positioning Analysis software incorporates several mapping techniques that enable firms to develop differentiation and positioning strategies for their products. By using this tool, managers can visualize the competitive structure of their markets as perceived by their customers. Typically, data for mapping are customer perceptions of existing products (and new concepts) along various attributes, customer preferences for products, or measures of behavioral response of customers toward the products (e.g., current market shares of the products).
Positioning Analysis uses perceptual mapping and preference mapping techniques. Perceptual-mapping helps firms to understand how customers view their product(s) relative to competitive products. The preference map introduces preference vectors or ideal points for each respondent on to a perceptual map. The ideal point represents the location of the (hypothetical) product that most appeals to a specific respondent. The preference vector indicates the direction in which a respondent’s preference increases. In other words, a respondent’s “ideal” product lies as far up the preference vector as possible. The preference map starts out with a perceptual map giving the locations of the product alternatives. In the second step, it introduces for each respondent either an ideal brand or a preference vector.
Positioning Analysis also helps firms to answer such questions as:
- Based on customer perceptions, which target segments are the most attractive?
- How should we position our new products with respect to our existing products?
- How do our customers view our brand?
- What product name is closely associated with the attributes that our target segment perceives as desirable?
- Which brands do our target segments see as our closest competitors?
- What product attributes are responsible for the perceived differences between products?
- How would changes in a product’s perceived attributes alter the product’s market share?
Key features
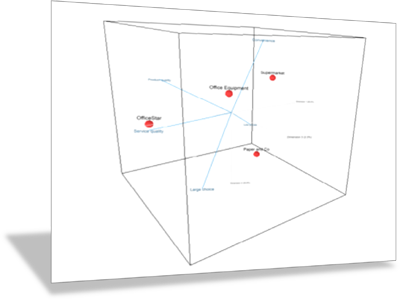
3D interactive positioning
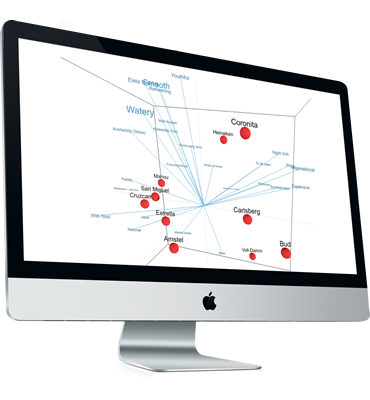
When two dimensions are not enough to capture the full complexity of the competitive landscape, Enginius will display a third dimension. That 3D, interactive map can be rotated, zoomed, and easily manipulated to easily visualize the positioning map.
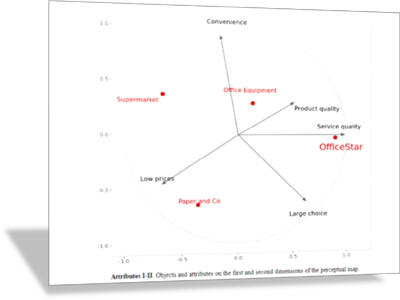
Map preferences
To be successfully positioned in the market place, it is not enough for a brand to be associated with a distinctive feature or characteristic; that characteristic needs to be valued and conducive to customer preferences and sales as well. When available, Enginius will map customer preferences directly on top of the perceptual data, to easily identify market opportunities and promising niche markets.
Segment preferences on the fly
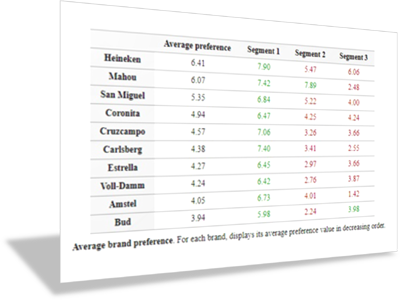
Customers’ preferences can be all over the place. Enginius will allow you to segment customer preferences, and directly map them in different colors. It can even automatically suggest the optimal number of segments to summarize your data. And if you want to use your own segment solution and labels, Enginius will let you specify it as well.


